Bonjour,
J’ai bidouillé un petit script pour avoir une droite de régression linéaire et 2 écart-types sur TradingView, ça a l’air de bien fonctionner et j’obtiens quasi les mêmes résultats qu’Hiboo et Belignac.
Voici le code :
//@version=5
indicator('Droite de regression et écart-types x2', overlay = true, max_lines_count = 500, max_labels_count = 500)

src = input.source(defval = close, title = 'Source')
compteur = input.int(defval = 0, title = 'Nombre de bougies')
mult = input.int(defval = 1, title='Ecart-type 1', options=[1,2,3,4,5,6,7,8,9,10])
mult2 = input.int(defval = 2, title='Ecart-type 2', options=[1,2,3,4,5,6,7,8,9,10])

if compteur == 0
    compteur := last_bar_index

var tableInfos = table.new(position = position.top_center, columns = 2, rows = 3, border_width = 1, border_color = #2b4bb4, frame_width = 1, frame_color = #2b4bb4)

//Calcul de la pente de la droite de régression
calcSlope(src, len) =>
    //max_bars_back(src, 300)
    if len <= 1
        [float(na), float(na), float(na)]
    else
        sumX = 0.0
        sumY = 0.0
        sumXSqr = 0.0
        sumXY = 0.0
        for ii = 0 to len - 1 by 1
            val = src[ii]
            per = ii + 1.0
            sumX := sumX + per
            sumY := sumY + val
            sumXSqr := sumXSqr + per * per
            sumXY := sumXY + val * per
            sumXY
        slope = (len * sumXY - sumX * sumY) / (len * sumXSqr - sumX * sumX)
        average = sumY / len
        intercept = average - slope * sumX / len + slope
        [slope, average, intercept]
//pente en %
[sss, aaa, iii] = calcSlope(src, compteur)

//Calcul des prix de départ et de fin du graphique
var prix_debut = 0.0
var prix_fin = 0.0

if barstate.isfirst
    prix_debut := close
if barstate.islast
    prix_fin := close

//Fonction pour calculer le taux d'évolution
function_pourcentage_evolution_droite(prix_debut, prix_fin, periodes) =>
    p = math.round(periodes/12)//On divise par 12 mois
    c1 = (prix_debut/prix_fin)
    pourcentage_droite = (math.pow(c1, 1/p)-1)*100
    [pourcentage_droite]

[pente] = function_pourcentage_evolution_droite(prix_debut, prix_fin, compteur)

//On calcul si notre pente est positive ou négative :
pente := if prix_debut < prix_fin
    math.abs(math.round(pente,2))
else
    math.round(pente,2)*-1

prix_il_y_a_5_ans = request.security(syminfo.tickerid, "D", close[1825])
[prix_debut_5_ans] = function_pourcentage_evolution_droite(prix_il_y_a_5_ans, prix_fin, 60)// 60 = il y a 60 mois en 5 années
prix_debut_5_ans := if prix_debut_5_ans < prix_fin
    math.abs(math.round(prix_debut_5_ans,2))
else
    math.round(prix_debut_5_ans,2)*-1

table.cell(table_id = tableInfos, column = 0, row = 0, text = 'Pente moyenne / an\n(affichage en années indispensable) :', text_halign = text.align_right)
table.cell(table_id = tableInfos, column = 1, row = 0, text = str.tostring(pente)+' % / an', text_color=#2b4bb4, text_halign = text.align_left)
table.cell(table_id = tableInfos, column = 0, row = 1, text = 'Pente moyenne / an\n(sur ces 5 dernières années) :', text_halign = text.align_right)
table.cell(table_id = tableInfos, column = 1, row = 1, text = str.tostring(prix_debut_5_ans)+' % / an', text_color=#2b4bb4, text_halign = text.align_left)

devise = syminfo.currency
if syminfo.currency == "EUR"
    devise := "€"
else if syminfo.currency == "USD"
    devise := "$"
else
    devise := syminfo.currency

f_exponential_regression_from_arrays(_x_array, _price_array) =>
    int _size_y = array.size(_price_array)
    int _size_x = array.size(_x_array)
    float[] _y_array = array.new_float(_size_y)

    for _i = 0 to _size_y - 1
        array.set(_y_array, _i, math.log(array.get(_price_array, _i)))

    float _sum_x = array.sum(_x_array)
    float _sum_y = array.sum(_y_array)
    float _sum_xy = 0.0
    float _sum_x2 = 0.0
    float _sum_y2 = 0.0

    if _size_y == _size_x
        for _i = 0 to _size_y - 1
            float _x_i = nz(array.get(_x_array, _i))
            float _y_i = nz(array.get(_y_array, _i))
            _sum_xy := _sum_xy + _x_i * _y_i
            _sum_x2 := _sum_x2 + math.pow(_x_i, 2)
            _sum_y2 := _sum_y2 + math.pow(_y_i, 2)
            _sum_y2

    float _a = (_sum_y * _sum_x2 - _sum_x * _sum_xy) / (_size_x * _sum_x2 - math.pow(_sum_x, 2))
    float _b = (_size_x * _sum_xy - _sum_x * _sum_y) / (_size_x * _sum_x2 - math.pow(_sum_x, 2))

    float[] _f = array.new_float()

    for _i = 0 to _size_y - 1
        float _vector = _a + _b * array.get(_x_array, _i)
        array.push(_f, _vector)

    _slope = (array.get(_f, 0) - array.get(_f, _size_y - 1)) / (array.get(_x_array, 0) - array.get(_x_array, _size_x - 1))
    _y_mean = array.avg(_y_array)

    float _SS_res = 0.0
    float _SS_tot = 0.0

    for _i = 0 to _size_y - 1
        float _f_i = array.get(_f, _i)
        float _y_i = array.get(_y_array, _i)
        _SS_res := _SS_res + math.pow(_f_i - _y_i, 2)
        _SS_tot := _SS_tot + math.pow(_y_mean - _y_i, 2)
        _SS_tot

    _r_sq = 1 - _SS_res / _SS_tot

    float _sq_err_sum = 0

    for _i = 0 to _size_y - 1
        _sq_err_sum += math.pow(array.get(_f, _i) - array.get(_y_array, _i), 2)

    _dev = math.sqrt(_sq_err_sum / _size_y)

    [_f, _slope, _r_sq, _dev]

//Conception des droites
var prix_depart_ddr = 0.0
var prix_fin_ddr = 0.0

var float[] price_array = array.new_float(compteur)
var int[] x_array = array.new_int(compteur)

array.unshift(price_array, src)
array.pop(price_array)
array.unshift(x_array, bar_index)
array.pop(x_array)

var line[] reg_line_array = array.new_line()
var line[] dev_up_line_array = array.new_line()
var line[] dev_dn_line_array = array.new_line()
var line[] dev_up_line_array2 = array.new_line()
var line[] dev_dn_line_array2 = array.new_line()

float[] dev_up_array = array.new_float()
float[] dev_dn_array = array.new_float()
float[] dev_up_array2 = array.new_float()
float[] dev_dn_array2 = array.new_float()

var int step = compteur-1
var int line_n = 1

if barstate.isfirst
    array.unshift(reg_line_array, line.new(x1=na, y1=na, x2=na, y2=na, color=#fd5200, width=2))

    for i = 0 to math.floor(line_n / 2) - 1
        array.unshift(dev_up_line_array, line.new(x1=na, y1=na, x2=na, y2=na, style=line.style_dashed, color=color.gray))
        array.unshift(dev_dn_line_array, line.new(x1=na, y1=na, x2=na, y2=na, style=line.style_dashed, color=color.gray))
        array.unshift(dev_up_line_array2, line.new(x1=na, y1=na, x2=na, y2=na, style=line.style_dashed, color=color.gray))
        array.unshift(dev_dn_line_array2, line.new(x1=na, y1=na, x2=na, y2=na, style=line.style_dashed, color=color.gray))

if barstate.islast
    [predictions, slope, r_sq, dev] = f_exponential_regression_from_arrays(x_array, price_array)

    for i = 0 to array.size(predictions) - 1
        array.push(dev_up_array, math.exp(array.get(predictions, i) + mult * dev))
        array.push(dev_dn_array, math.exp(array.get(predictions, i) - mult * dev))
        array.push(dev_up_array2, math.exp(array.get(predictions, i) + mult2 * dev))
        array.push(dev_dn_array2, math.exp(array.get(predictions, i) - mult2 * dev))

    for i = 0 to array.size(predictions) - 2 - step by step
        line.set_xy1(array.get(reg_line_array, i / step), x=bar_index - i, y=math.exp(array.get(predictions, i)))
        line.set_xy2(array.get(reg_line_array, i / step), x=bar_index - i - step, y=math.exp(array.get(predictions, i + step)))
        if barstate.islast
            var l1 = label.new(x=bar_index + 7, y=math.exp(array.get(predictions, i)), text=str.tostring(math.round(math.exp(array.get(predictions, i)), 2))+" "+devise, style=label.style_none, textalign = text.align_left, textcolor = #fd5200)

    for i = 0 to array.size(dev_up_array) - 2 - step by step * 2
        line.set_xy1(array.get(dev_up_line_array, i / (step * 2)), x=bar_index - i, y=array.get(dev_up_array, i))
        line.set_xy2(array.get(dev_up_line_array, i / (step * 2)), x=bar_index - i - step, y=array.get(dev_up_array, i + step))
        line.set_xy1(array.get(dev_dn_line_array, i / (step * 2)), x=bar_index - i, y=array.get(dev_dn_array, i))
        line.set_xy2(array.get(dev_dn_line_array, i / (step * 2)), x=bar_index - i - step, y=array.get(dev_dn_array, i + step))
        if barstate.islast
            label.new(x=bar_index + 7, y=array.get(dev_up_array, i), text=str.tostring(math.round(array.get(dev_up_array, i), 2))+" "+devise, style=label.style_none, textalign = text.align_left, textcolor = color.gray)
            label.new(x=bar_index + 7, y=array.get(dev_dn_array, i), text=str.tostring(math.round(array.get(dev_dn_array, i), 2))+" "+devise, style=label.style_none, textalign = text.align_left, textcolor = color.gray)

    for i = 0 to array.size(dev_up_array2) - 2 - step by step * 2
        line.set_xy1(array.get(dev_up_line_array2, i / (step * 2)), x=bar_index - i, y=array.get(dev_up_array2, i))
        line.set_xy2(array.get(dev_up_line_array2, i / (step * 2)), x=bar_index - i - step, y=array.get(dev_up_array2, i + step))
        line.set_xy1(array.get(dev_dn_line_array2, i / (step * 2)), x=bar_index - i, y=array.get(dev_dn_array2, i))
        line.set_xy2(array.get(dev_dn_line_array2, i / (step * 2)), x=bar_index - i - step, y=array.get(dev_dn_array2, i + step))
        if barstate.islast
            label.new(x=bar_index + 7, y=array.get(dev_up_array2, i), text=str.tostring(math.round(array.get(dev_up_array2, i), 2))+" "+devise, style=label.style_none, textalign = text.align_left, textcolor = color.gray)
            label.new(x=bar_index + 7, y=array.get(dev_dn_array2, i), text=str.tostring(math.round(array.get(dev_dn_array2, i), 2))+" "+devise, style=label.style_none, textalign = text.align_left, textcolor = color.gray)

if barstate.islast
    table.cell(table_id = tableInfos, column = 0, row = 2, text = 'Prix de clôture :', text_halign = text.align_right)
    table.cell(table_id = tableInfos, column = 1, row = 2, text = str.tostring(math.round(close,2))+" "+devise, text_color=#2b4bb4, text_halign = text.align_left)
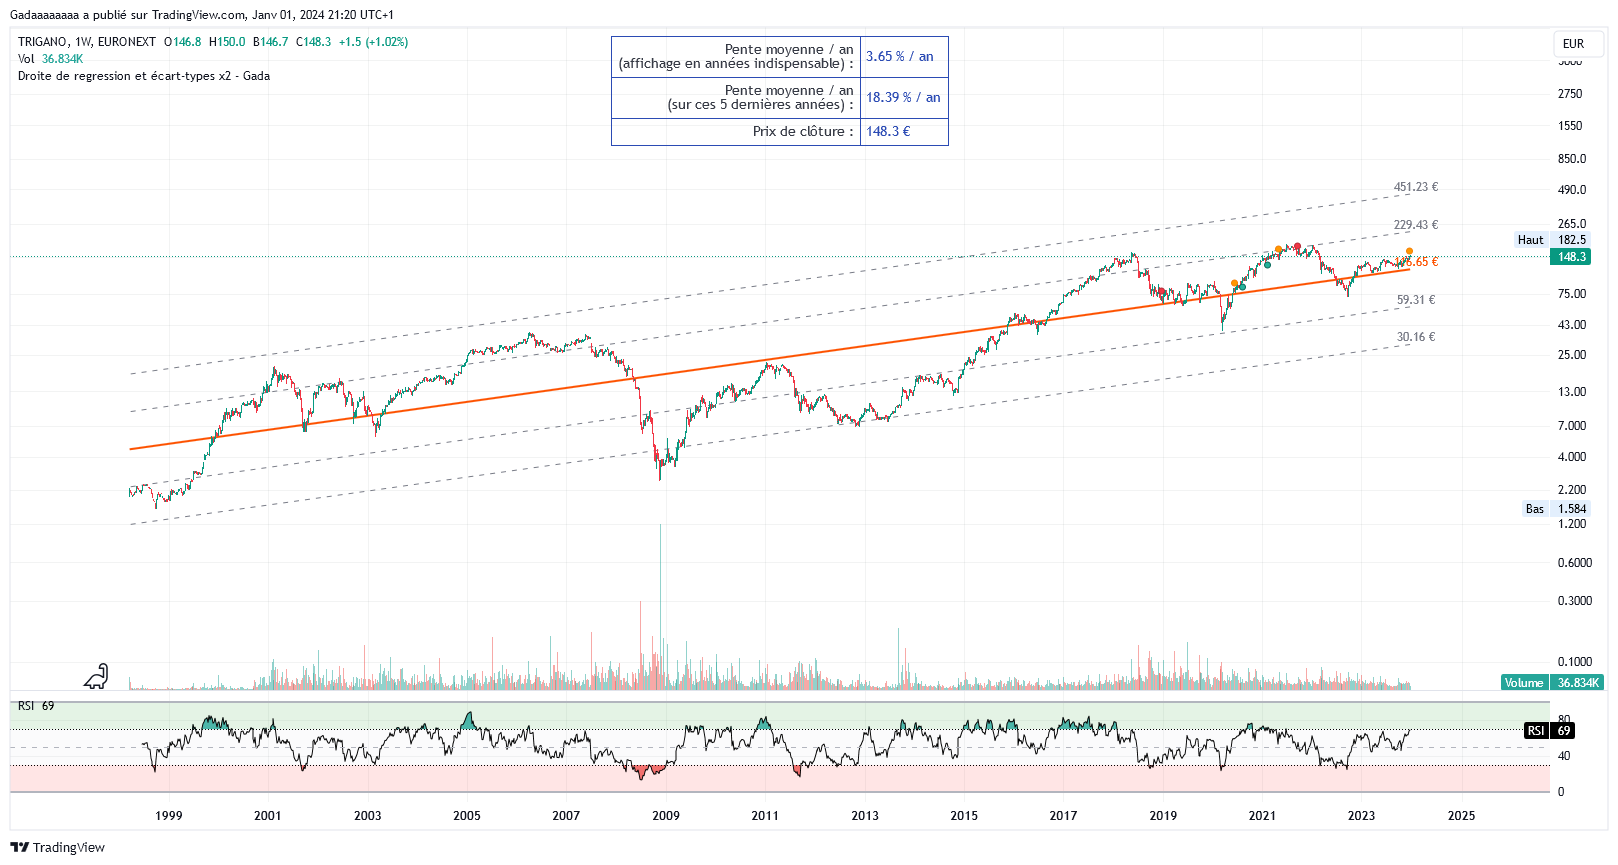
ça donne ce genre de résultats (exemple : Trigano ; EPA:TRI) :
J’espère que cela pourra vous éclairer un peu.
Je vous souhaite une bonne journée et une belle année 2024.
PS : Le graphique doit être en log pour que le script fonctionne correctement
PS2 : Le script est davantage pertinent avec un affichage en années